
Deep-Value Signals | Week 42 (Part 2): The Big Picture

Another wild week but also one that calls for a bit of caution. When everything feels bullish and margin debt is brushing new highs, that’s usually the moment to stay sharp. Momentum is great, but prudence matters even more when euphoria creeps in.
That’s part of the reason I trimmed some exposure in gold and silver earlier this week and rotated into areas that remain undervalued relative to silver, most of which were covered in Part 1.
If you haven’t read Part 1 yet, please do so first: you’ll find it here. That’s a mandatory read before continuing; it sets the broader context for these moves, including the rotation logic and structural positioning.
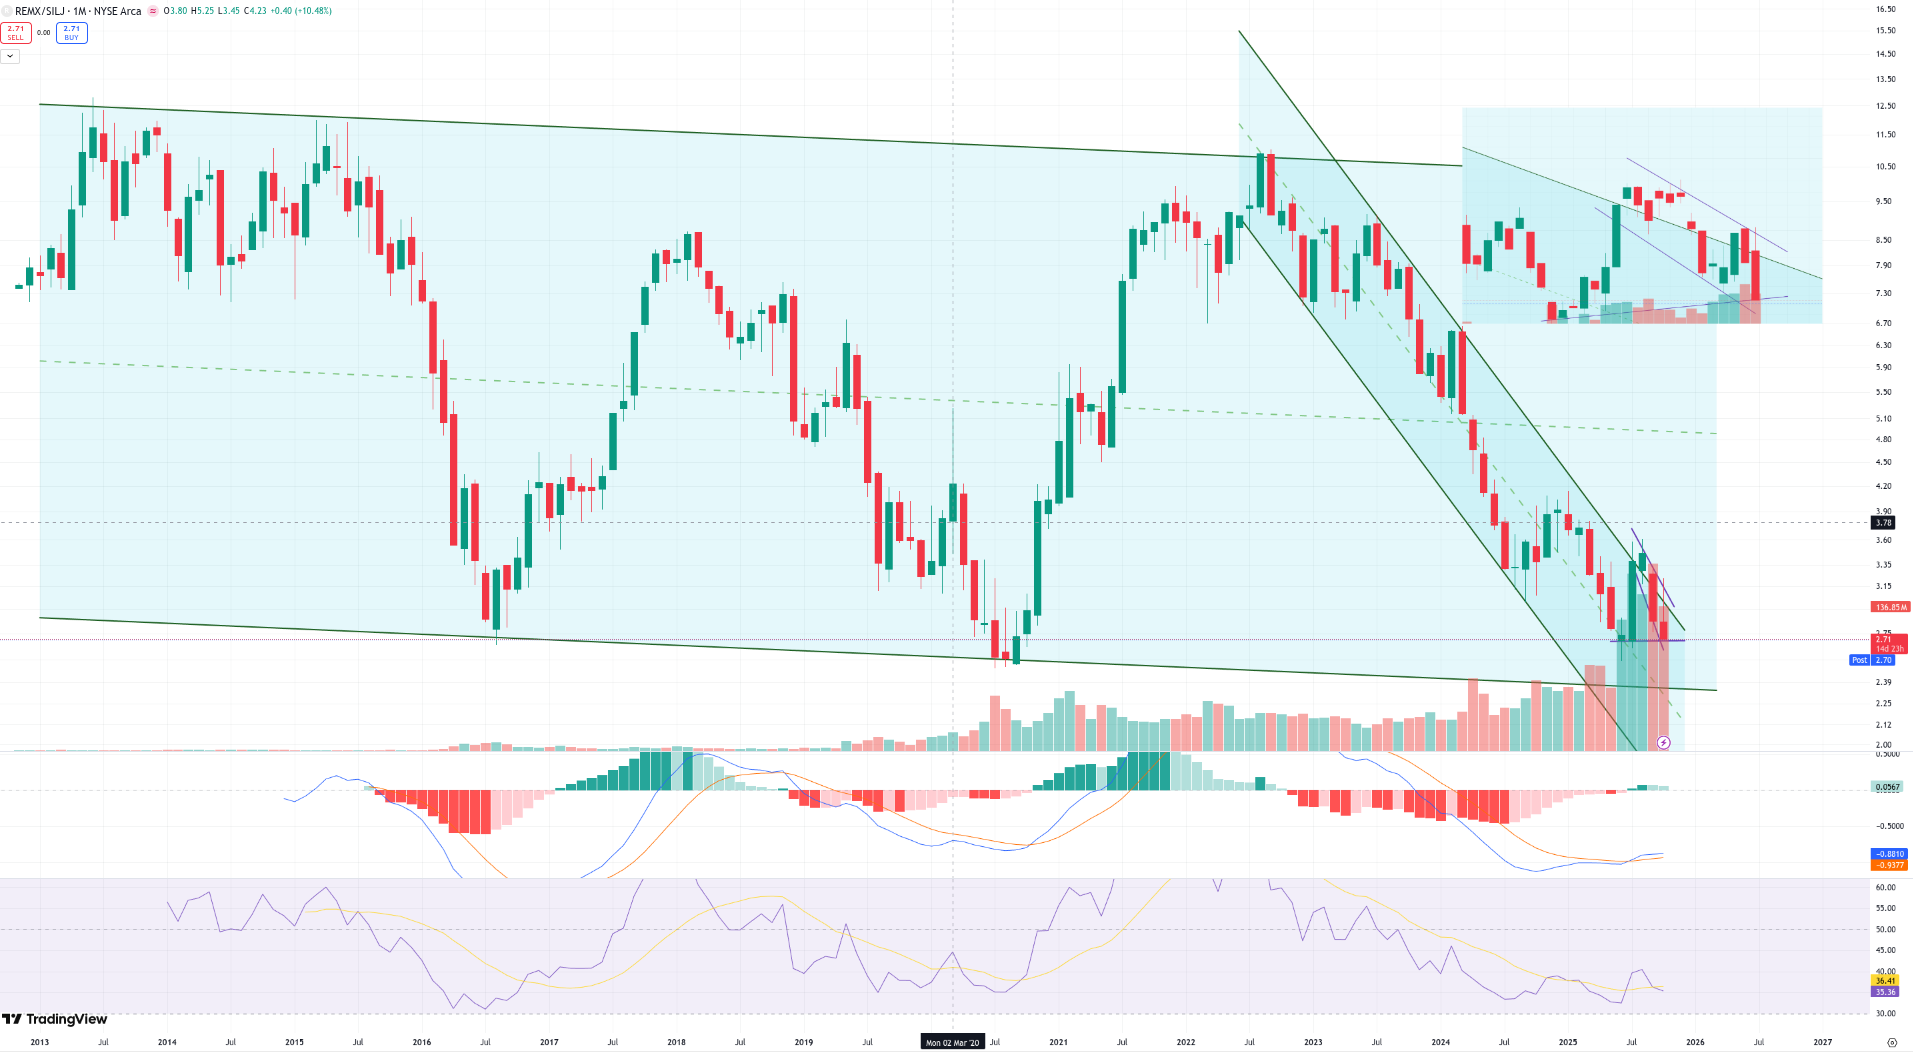
Since last Tuesday’s update, we’ve seen a sharp bounce back into the channel, turning what looked like a clean breakout into another false move for now. On the monthly chart, the ratio continues to drift along the lower boundary of its long-term downtrend, with price action showing clear signs of exhaustion.
Momentum is flattening, volume is fading, and RSI has been pinned near oversold territory for months; all consistent with a mature, late-stage decline rather than a new leg lower. From a risk-reward standpoint, this area remains asymmetric: silver has run hard into resistance, while the broader fundamentals - particularly around China’s critical-mineral leverage and supply-chain policy - still favour a gradual rotation back toward magnet metals and industrials.
In short: for now, it’s another fake breakout, but the structure is tightening. The next decisive move in this ratio will likely mark the next phase of capital rotation; either confirmation that silver’s outperformance is peaking, or validation that policy-driven criticals are ready to take the lead again.
Silver: long-term resistance in play
In the first chart below, you’ll see my long-term monthly silver chart, which stretches all the way back to the 1980s. The blue and purple lines on the left-hand side are the key reference levels I’ve been tracking for months.
the 1980 high, and
the 2011 high, both marked by their monthly closes and peaks.
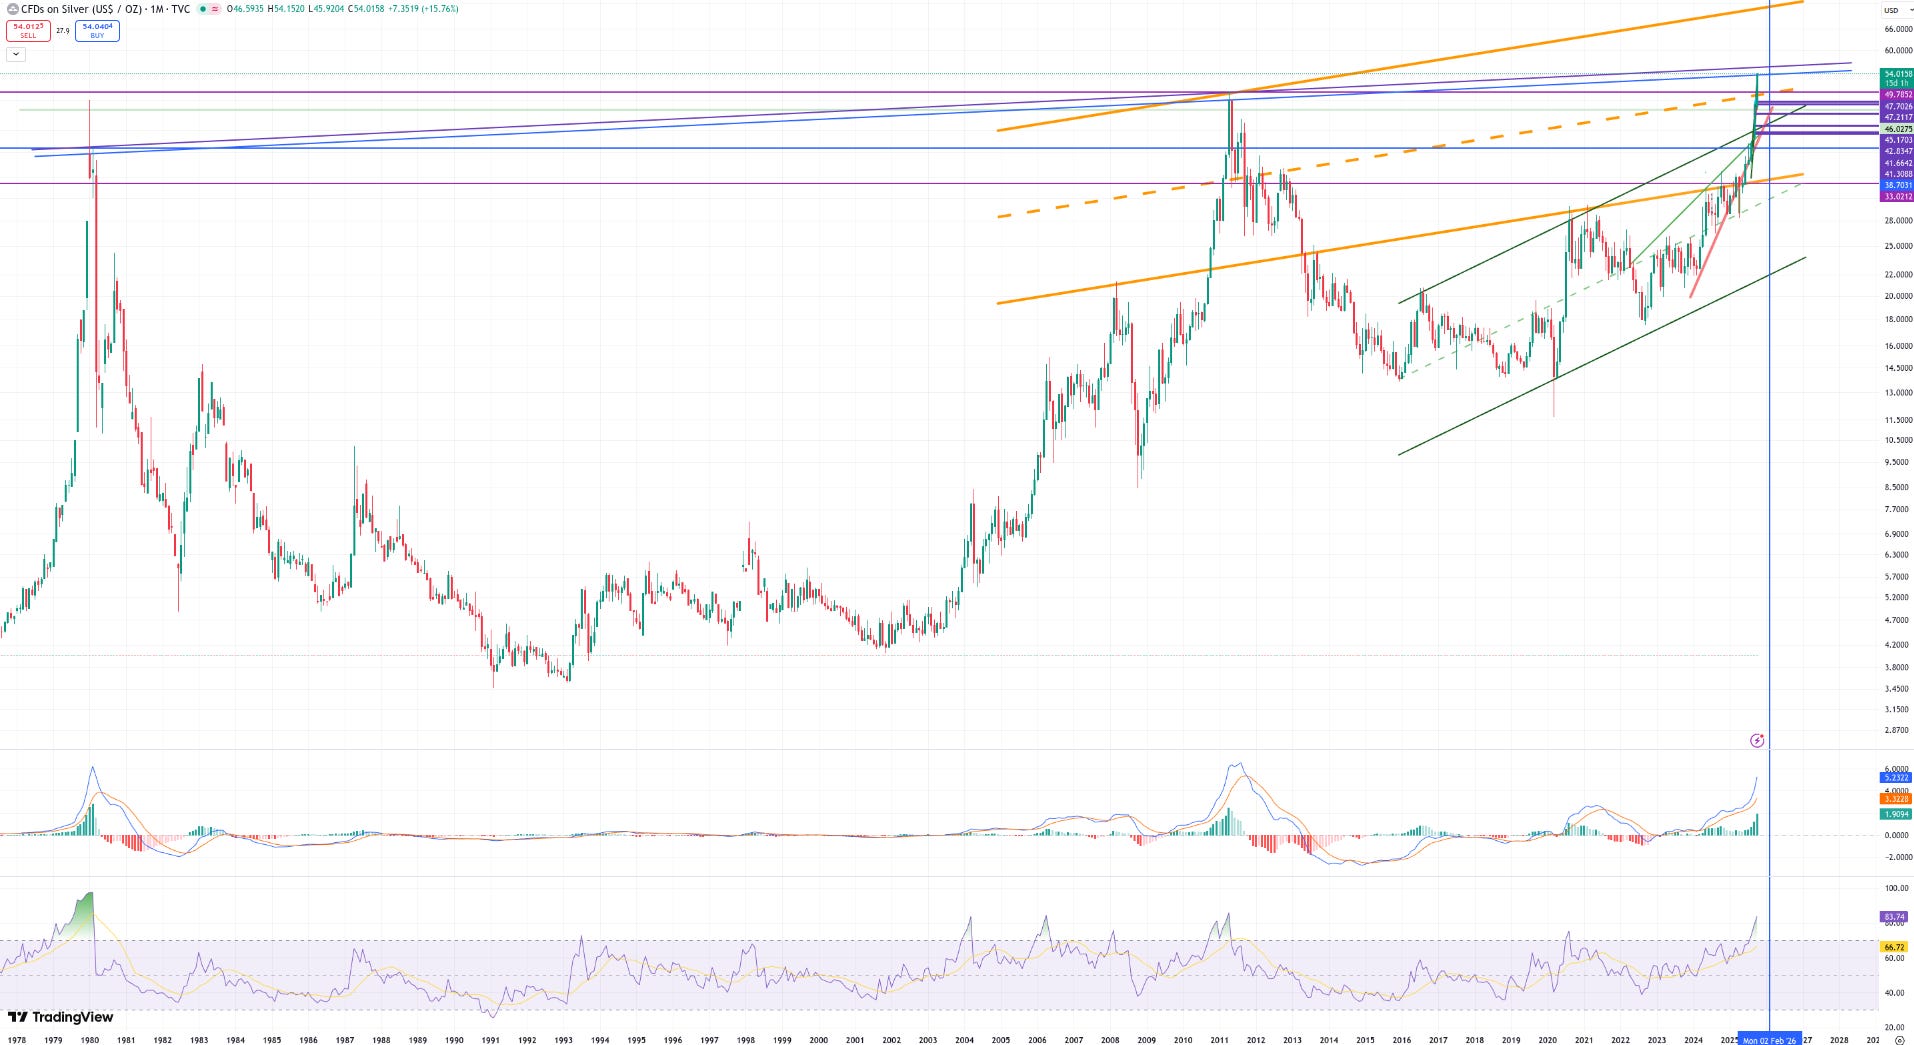
Price has now touched that upper trend line perfectly, right at the intersection of these historic resistance zones. On my chart, that region corresponds roughly with the $54–$56 range: the area that capped every major rally over the last four decades.
This isn’t what I call a confirmed breakout yet. I don’t care much for intraday or even weekly closes at this level; what matters here is the monthly close. Only if silver can deliver a sustained monthly close above $56 would that qualify as a structural breakout in my book. That would shift the technical narrative entirely and open the path toward uncharted territory. Until then, this is simply the market retesting a historic lid.
In short: silver remains exceptionally strong, but I’m cautious here. A breakout on this timeframe would be game-changing; anything short of that is still a test, not a resolution.
S&P 500: upper channel grind
Switching to equities, the S&P 500 continues to grind higher within its long-term rising channel. I’ll briefly touch on the monthly, weekly, and daily setups here - though I’m only displaying the weekly chart below, as it captures the structure best.
On the monthly, the index has climbed to the very top of its structural channel - the same one stretching back to 2009. The move remains technically intact, momentum still positive, and RSI elevated but not extreme. Yet every time we’ve reached this zone in the past, risk-reward has compressed and volatility has followed.
The weekly view makes that tension clearer. The S&P is hugging the upper rail of the channel, with every minor dip getting absorbed almost instantly. Volume is thinning out, MACD is positive but flattening, and the leg looks mature, more extension than fresh impulse.
On the daily, momentum is holding but starting to diverge slightly from price. The trend is still higher, but short-term breadth is narrowing.
In short: the structure is constructive but stretched. Momentum traders are still in control, yet with margin debt near record highs and positioning heavily one-sided, this is the kind of setup where even small cracks can widen quickly. A pause or mild pullback here would be healthy; a chance for the trend to reset before the next leg.
Volatility: a subtle shift beneath the surface
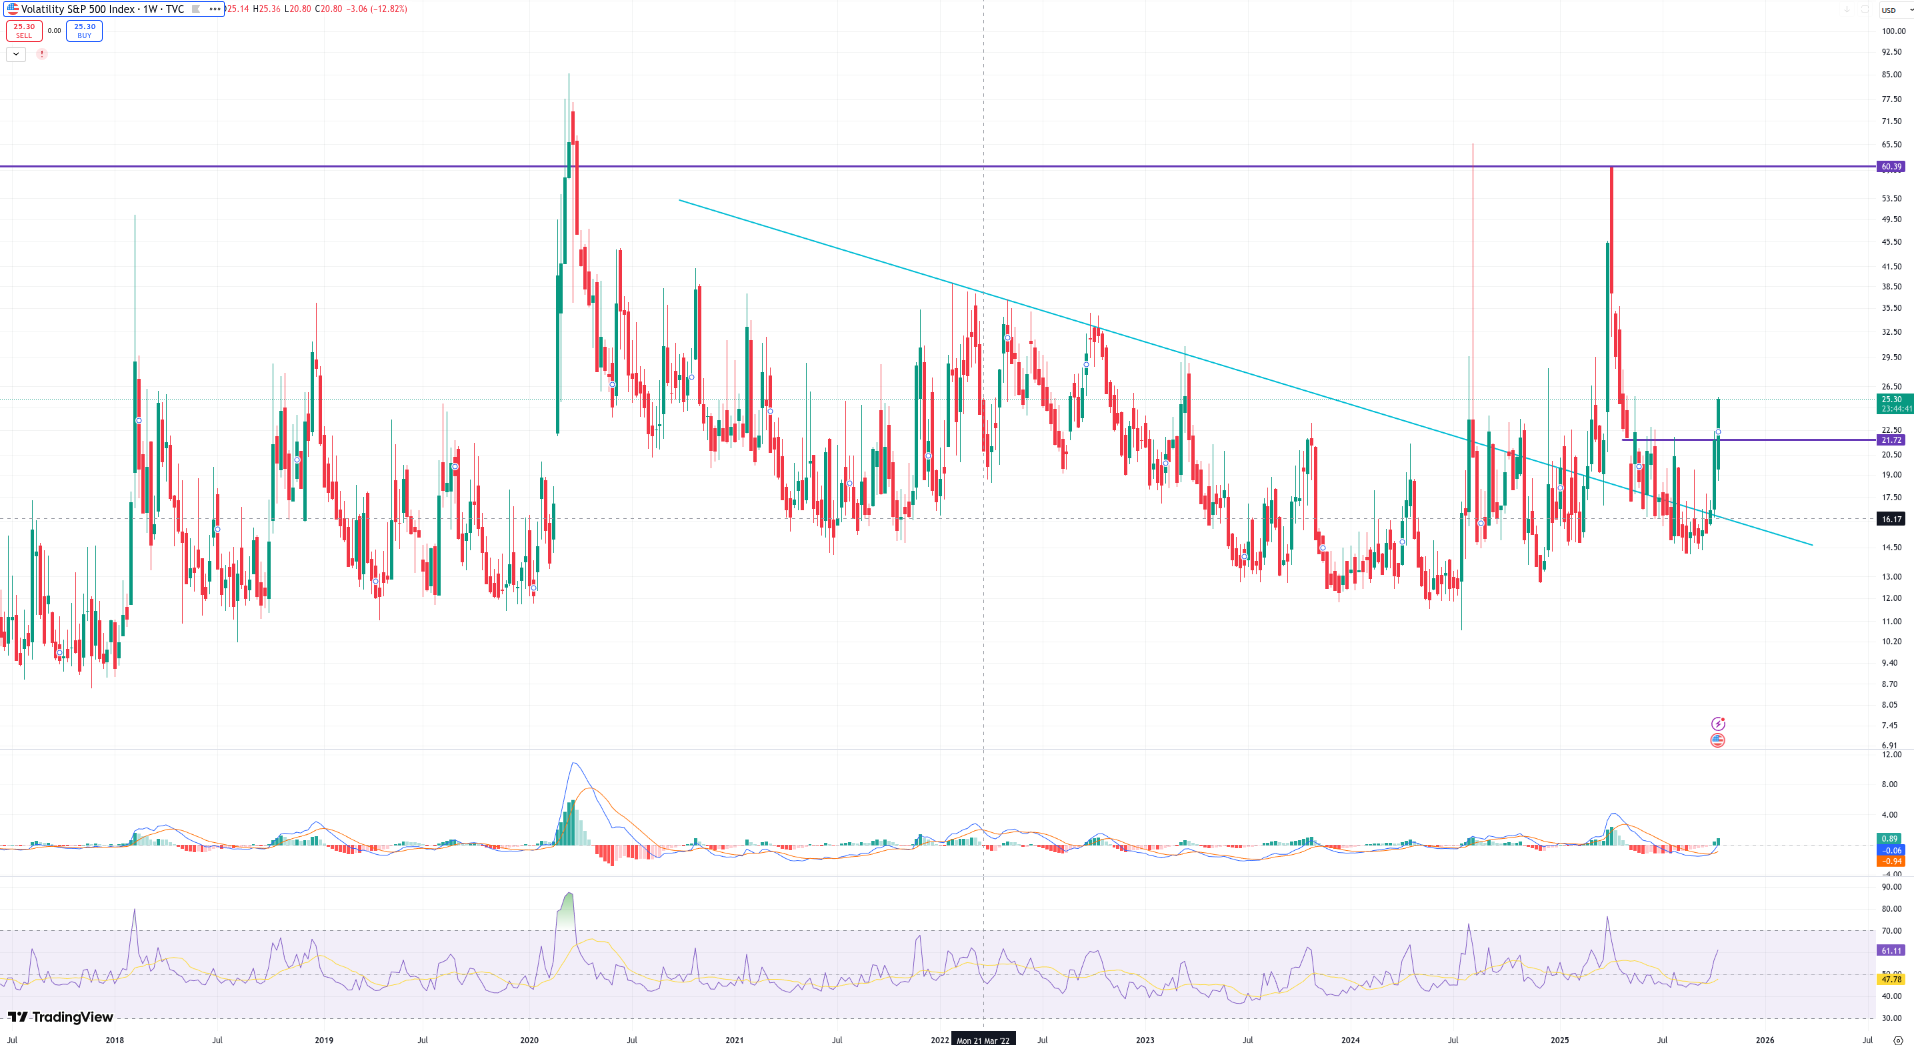
Lastly, let’s turn to volatility; the quiet gauge that tells you when markets are getting a little too comfortable. I’ll touch on the daily, weekly, and monthly setups, but I’m only displaying the weekly chart below, as it captures the structure best.
On the daily, volatility has broken above its short-term downtrend and pushed through the 21–22 resistance band that capped every rally attempt since summer. It’s not a crisis-level spike, but it’s enough to remind everyone that mean reversion still exists. MACD has flipped positive, RSI is stretching, and momentum has clearly returned to the tape.
The weekly chart shows this move in fuller context: the VIX has broken decisively through its descending resistance line dating back to early 2022. That move lifts it back into the upper half of its multi-year range - a sign that complacency is starting to fade. So far, this looks less like a one-off scare and more like the early stage of a volatility regime shift.
On the monthly, the downtrend that defined the post-COVID period has finally been tested and breached. Historically, that doesn’t mean a crash is imminent, but it often signals the transition from suppressed volatility to normalization - risk premiums rising, not panic.
In short: volatility isn’t screaming fear, but it’s no longer asleep either. The break above 21–22, confirmed on the weekly close, is a subtle but important warning that the easy ride may be ending. It ties neatly into what we’re seeing across silver and equities: strong trends pressing major resistance, margin debt at highs, and sentiment running hot.
If silver consolidates or the S&P rolls off its upper channel, this early lift in volatility will likely be the canary that warned us first.
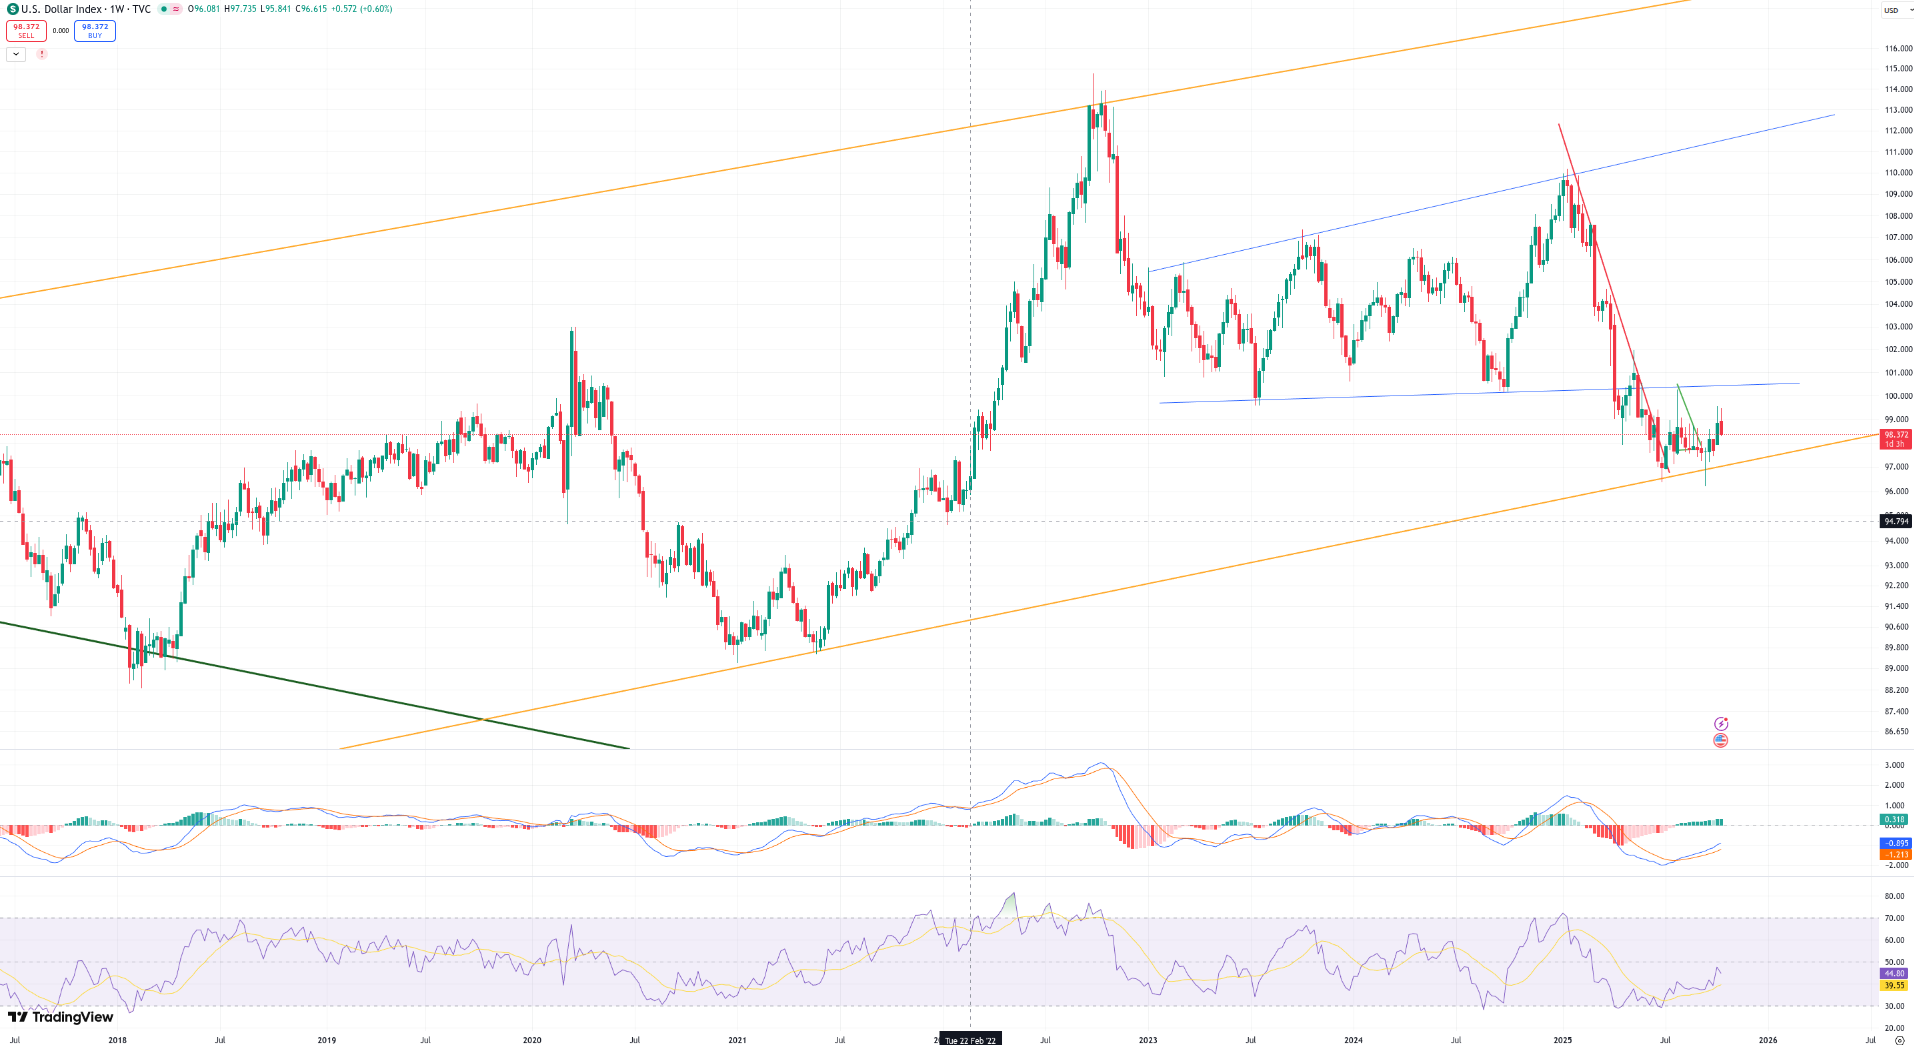
U.S. Dollar Index (DXY): back at structural support
The last piece of the macro puzzle is the U.S. Dollar Index (DXY); and it’s sitting at a fascinating point in its long-term structure. I’ll touch briefly on the monthly, weekly, and daily perspectives, but I’m only displaying the weekly chart below, since it illustrates the setup best.
On the monthly, the dollar has pulled back to the lower rail of its rising orange channel, which dates back to the 2011 lows. This zone around 96–97 has acted as structural support multiple times over the past decade. Momentum has cooled but hasn’t turned negative. RSI sits neutral, and MACD is flat after a long unwind from the 2022 blow-off peak. What stands out is the long-term downtrend line from the 1980s; once heavy resistance, now flipped into support. Price is retesting that level from above, and so far it’s holding.
The weekly view sharpens the picture. The DXY has been trading inside a tight consolidation channel between 97 and 100, with near-term resistance around 100.20. The most recent pullback hit the lower boundary almost perfectly, producing a modest reversal candle and a small MACD uptick. It’s not a breakout, but it does reaffirm that the dollar’s bigger structure remains corrective, not broken.
On the daily, momentum has been oscillating rather than trending. The sharp red downtrend from 2022 is long gone, replaced by a gentle green rebound channel. RSI is mid-range, signaling balance rather than exhaustion. For now, this looks like a basing phase, not a breakdown.
Macro Summary
To bring it all together:
Silver has reached its four-decade ceiling near $55–$56: a powerful move, but not yet a confirmed breakout.
The S&P 500 continues pressing the top of its long-term channel: still constructive, but increasingly stretched.
Volatility (VIX) has quietly awakened, breaking resistance and signaling the first meaningful regime shift in two years.
And the U.S. Dollar Index has slipped into structural support, right where it could stabilize or rebound if risk sentiment cools.
Taken together, the setup is straightforward: momentum across risk assets remains strong, but the risk-reward balance is tightening. This is a phase for discipline, not fear; trimming where froth builds, adding only where structure still favors asymmetry. For now, I’m keeping a steady hand: rotating into strength where it’s still undervalued, staying patient at resistance, and letting structure, not sentiment, dictate what comes next.
From here, we’ll shift gears into the paid section.
First, I’ll walk through the re-jigged Core 15; including the full news flow recap, updated entry zones, and stop-loss levels now that several names have hit their technical targets. Then we’ll cover a few positioning notes around the recent rotations, followed by the updated Watchlist with fresh setups across criticals and industrials.
Finally, I’ll introduce a new large-cap pick in the REE space - one that ties directly into the structural themes discussed above and bridges policy tailwinds with real scale. It’s a name that deserves a place on every institutional radar heading into Q4.