
Macro Overview | Year-End Perspective (2026-1)

First and foremost, Happy New Year to everyone.
2025 has treated commodity investors extremely well. As I mentioned to paid subscribers around the turn of the year, strong performance is welcome but it never grants immunity. Past returns don’t guarantee future ones, and the job now is to assess where we are, not celebrate where we’ve been.
That said, when you zoom out, the broader message remains constructive. The (commodity) CRB index relative to the S&P still suggests this commodity bull market is early, not late. Add to that a rolling DXY on the six-monthly timeframe (covered further below), and the macro backdrop remains supportive into 2026; even if the path forward is unlikely to be straight.
Given the year-end transition, I’m deliberately shifting the focus toward higher timeframes. For me, the 3-, 6-, and 12-month charts provide the cleanest signal when assessing where markets sit structurally and where the next multi-quarter move is most likely to emerge.
With that context, let’s start where attention is highest: silver.
Silver | First Touch, First Rejection
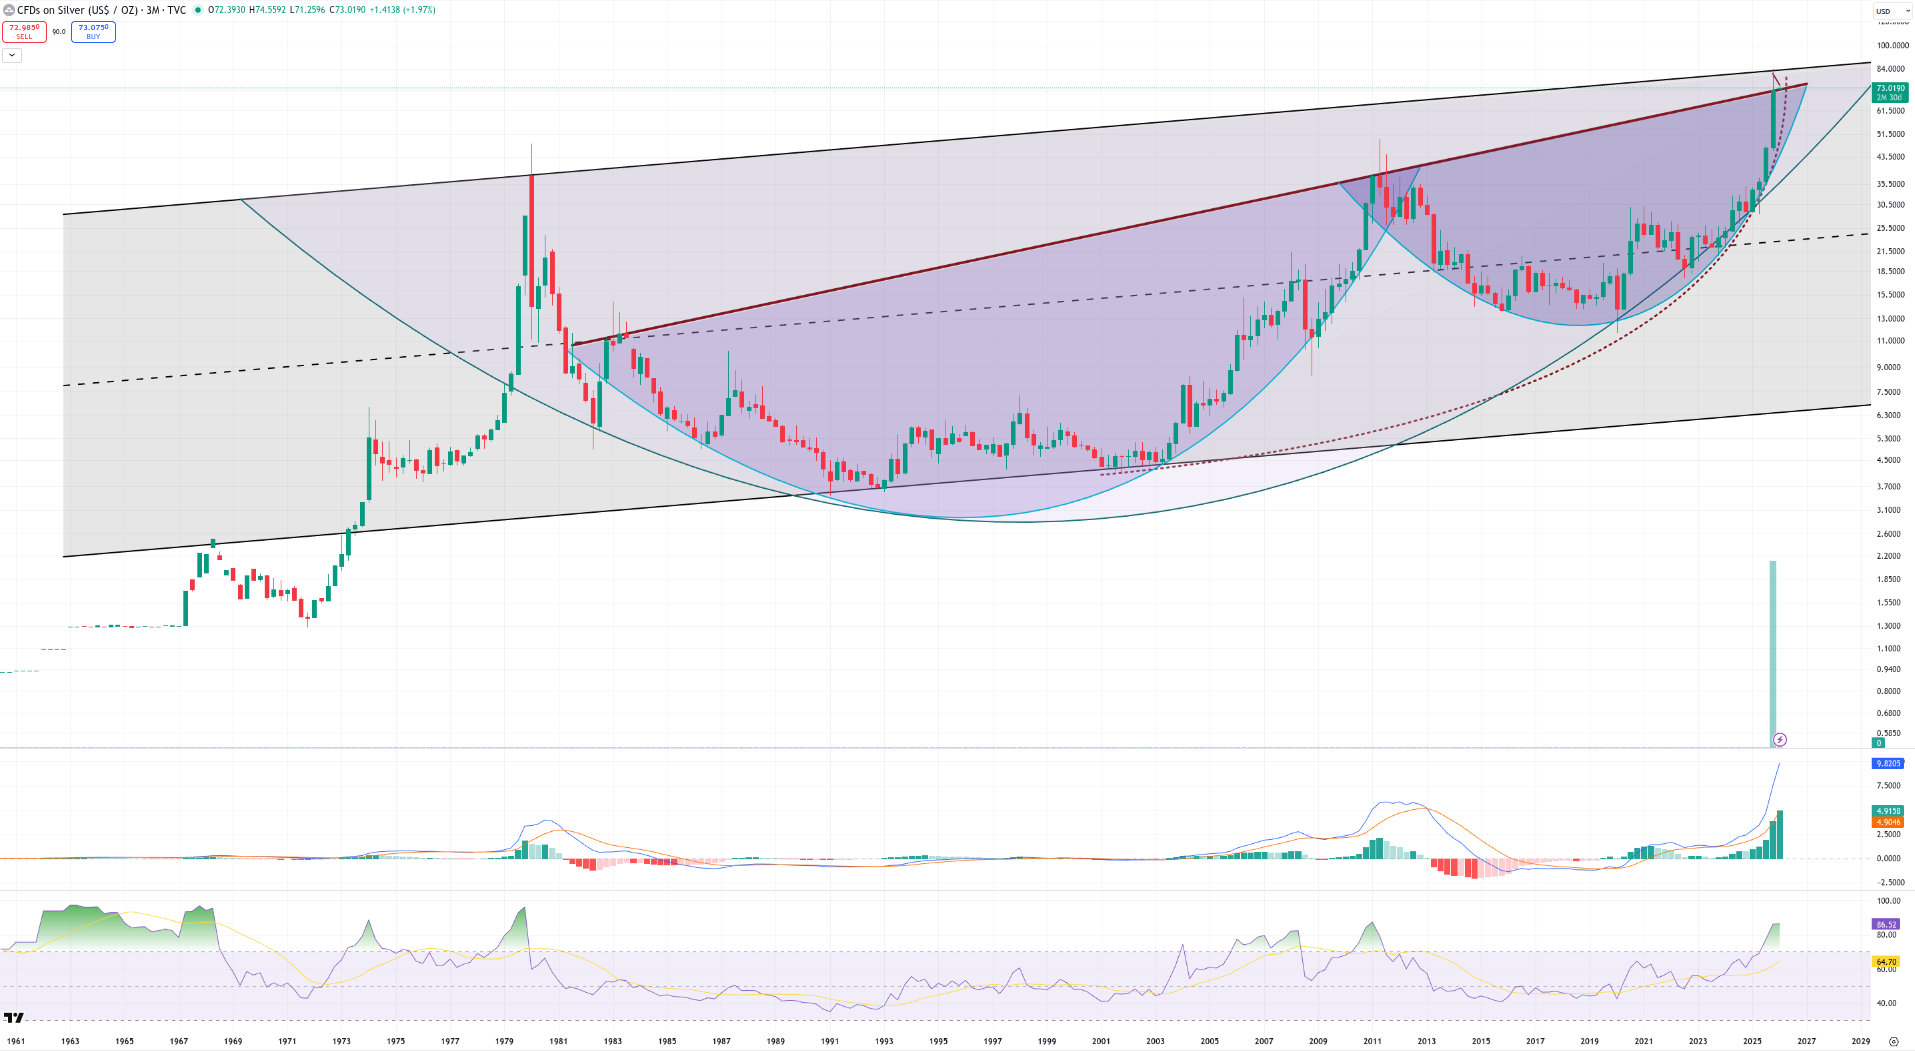
On the 3-monthly chart, silver did exactly what I discussed into year-end: it drove straight into the second cup lip / multi-decade channel lid in the 71–72 area… and stalled.
This is important. First touches on structures of this magnitude almost never produce clean, immediate breakouts; especially not after a near-vertical three-year advance. What we saw was the textbook outcome: kiss the ceiling, hesitate, not blast straight through to triple digits.
Structurally, nothing has broken. The secular channel dating back to the 1960s remains intact. The second mega-cup is complete. Price simply tagged the upper rail and printed its first meaningful hesitation candle. On this timeframe, MACD remains blown out, RSI is living in the 80s, and the final leg higher occurred with virtually no consolidation. That is not the backdrop from which sustainable regime shifts usually launch; it’s the backdrop from which markets cool, digest, and reset.
Because of that, I wouldn’t be surprised to see silver print a down year - or at least a weaker H1 - or even a flat year from here, contrary to the dominant “straight to three digits” narrative. That doesn’t invalidate the secular bull case; it simply implies that a handle or retracement inside the parabola is more likely than immediate escape velocity.
These were the scenarios I laid out before Christmas - before the CFTC raised margins and before Elon publicly flagged silver prices as a concern - and they still frame the outlook for 2026:
Base case | controlled rejection / handle formation (~55%)
The first touch of a multi-decade channel lid statistically favours a cool-off. The most likely path is a drift back toward the 71–72 trendline, with scope to overshoot into the 0.236 Fib (~65) and potentially probe the 0.382 zone (~55) over the coming 3-month candles. This would represent a classic momentum reset - constructive, not destructive - effectively carving out the handle on the second cup before a stronger attempt higher.
Bullish continuation | clean acceptance above the channel (~15%, now off the table)
This was always the low-probability outcome: a decisive 3-month close above the channel lid, followed by only a shallow back-test that held the low-70s. The fact that price respected the ceiling on first touch, exactly as expected, means this scenario did not materialise on the first attempt; fully consistent with historical precedent.
Hard rejection | deeper flush to major Fibonacci support (~30%)
A more forceful rejection from the channel lid could still open an air-pocket move toward the 0.5 Fib (~48) or even the 0.618 (~41). Uncomfortable in the short term, but still a higher low within the secular channel, not a secular top. This would delay resolution, not cancel it.
Bottom line:
Silver has finally met its forty-year ceiling and behaved exactly as a first touch should. Until the 3-monthly channel lid is decisively closed above, I continue to treat this as a powerful secular uptrend undergoing its first serious reset; with the real decision far more likely to occur on the second attempt, not the first.
S&P 500 | Trend Intact, Space Tightening
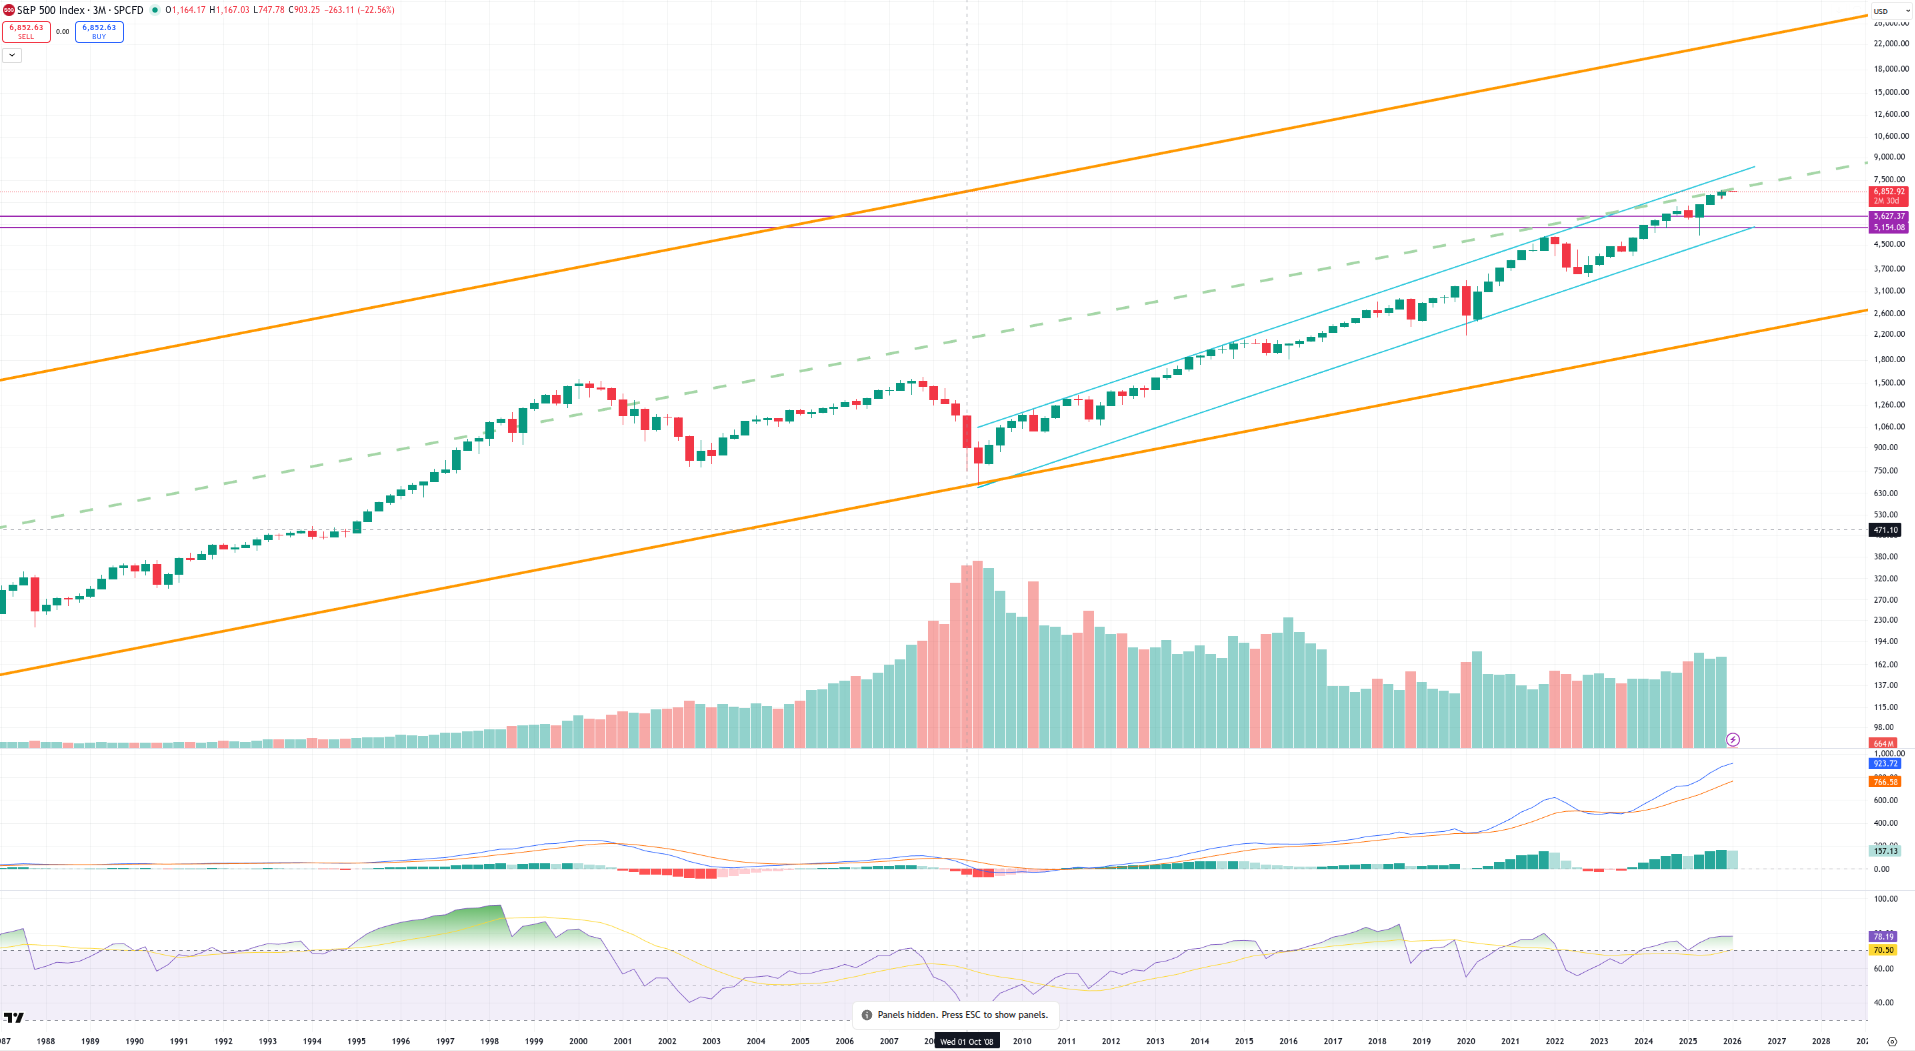
On the 3-month chart, the S&P 500 remains firmly inside its long-term rising channel that has governed price since the post-GFC era. There is no structural damage here. The trend is still up, the channel is respected, and higher highs and higher lows remain intact. But context matters and at this altitude, risk is no longer symmetric.
Price is now pressing into the upper half of the secular channel, a zone that has historically marked late-stage advances rather than early-cycle opportunity. Every prior visit to this region has resulted in one of three outcomes: a pause, a sideways digestion, or a meaningful but non-fatal correction. What it has not produced is a straight-line continuation without relief.
Momentum confirms this reading. On the 3M timeframe, MACD remains positive but is clearly extended after a multi-year expansion. RSI is elevated and beginning to lose slope; not rolling over aggressively, but no longer accelerating either. That combination doesn’t signal an imminent crash; it signals compression. The market isn’t breaking; it’s tightening.
Importantly, volume and participation no longer expand at the same rate as price. That divergence is subtle on short timeframes, but it shows up clearly when you zoom out: price keeps grinding higher, but it takes progressively more effort to do so. That’s a classic late-leg characteristic.
From a structural standpoint, the most important level is not some arbitrary pullback number; it’s the channel itself. As long as price holds within the rising orange rails, this remains a bull market. But the closer price gets to the upper boundary, the worse the forward risk-reward becomes for new capital.
In other words:
This is not a bearish setup.
This is a low-margin-for-error zone.
A cooling phase; either through time (sideways) or price (pullback toward the mid-channel) - would be the healthiest outcome and would reset conditions for a more durable continuation later on. A shallow pullback that holds the rising support would strengthen the structure, not weaken it.
The key takeaway for 2025 into 2026 is simple: The S&P 500 is still trending higher, but it is doing so late in the channel, not early in it. That’s a regime where trimming, rotating, or hedging makes sense; not because the bull market is over, but because the easy part of this leg is already behind us.
VIX | Compression Phase, Not Suppression Anymore
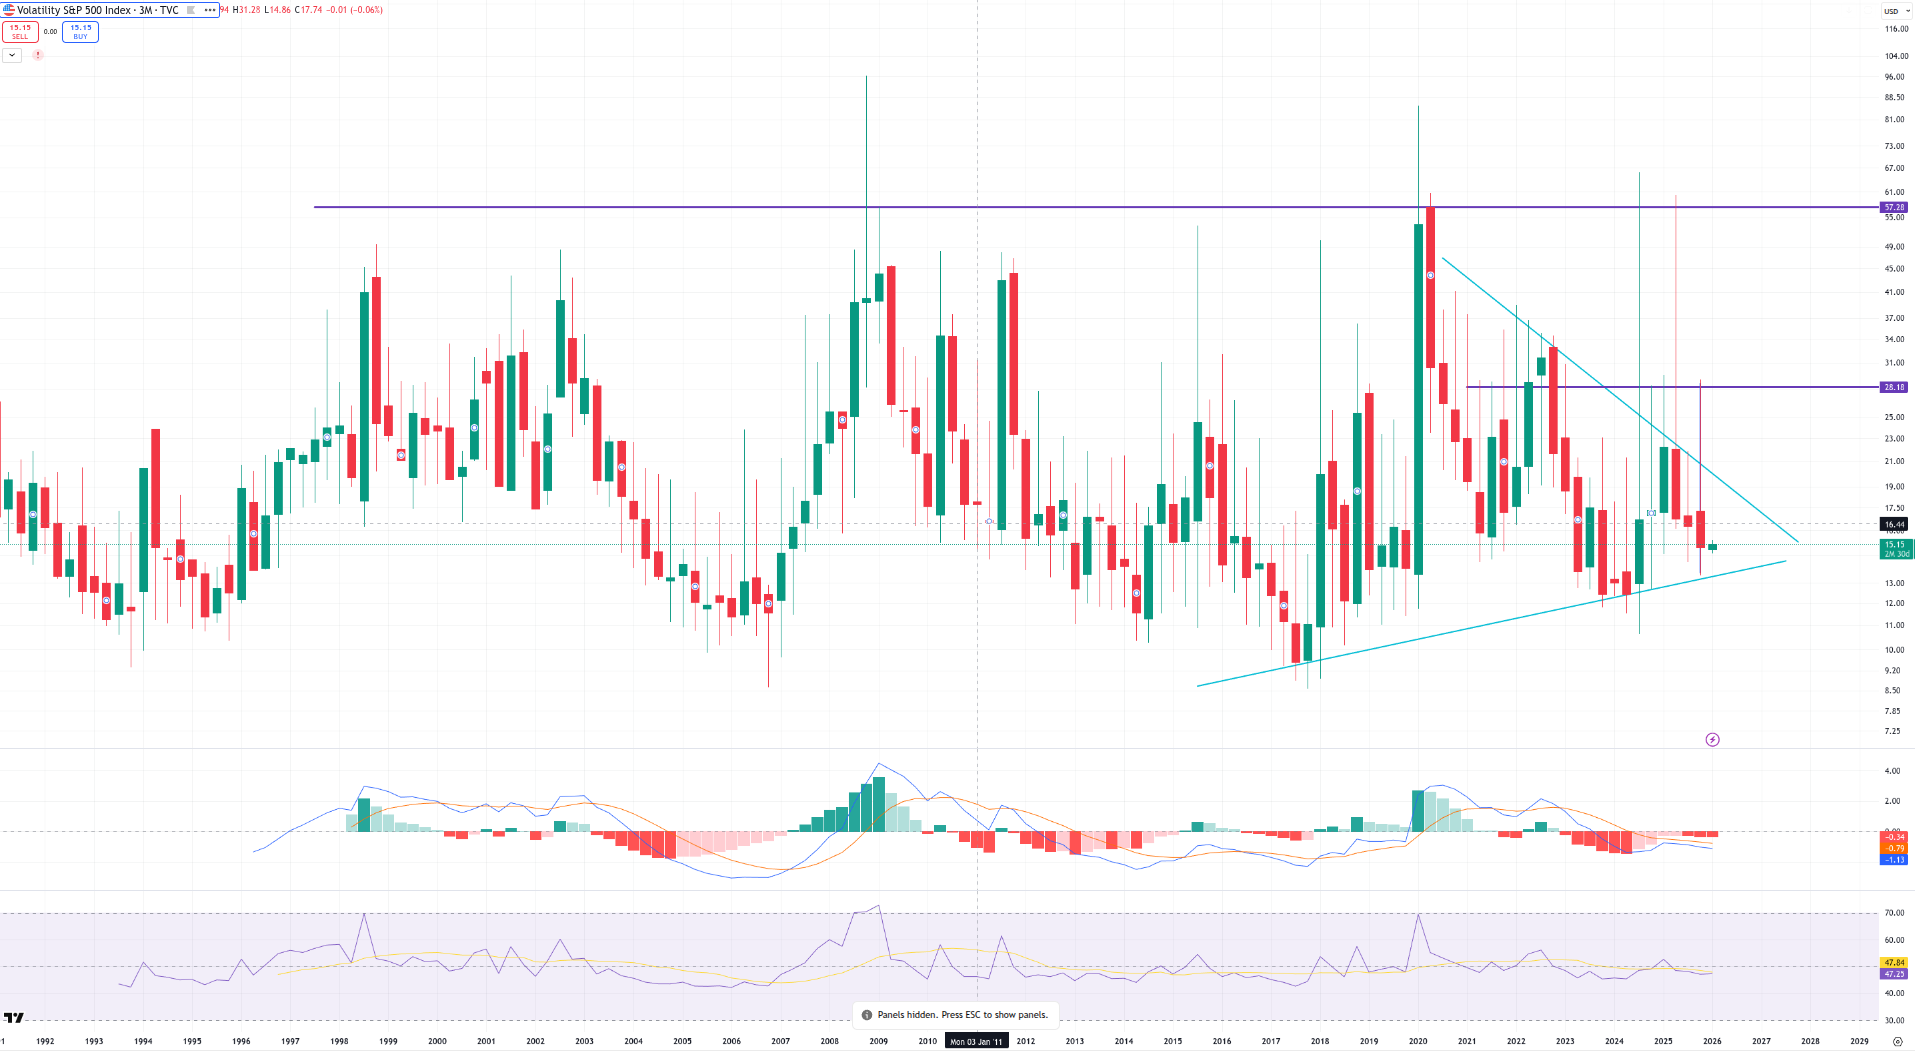
On the 3-month chart, the VIX continues to tell a quietly important story; not one of panic, but one of structural change. Volatility is no longer being crushed into ever-lower lows. Instead, it’s compressing upward inside a long-term wedge, with higher lows forming against a still-descending upper boundary.
That distinction matters. For most of the post-2020 period, volatility spikes were violent but fleeting, followed by aggressive suppression. That regime is fading. What we see now is persistent tension rather than episodic fear.
Structurally:
The VIX has put in successively higher lows since the mid-2010s.
The long-term descending trendline from the GFC era is still overhead, but price is now pressing into the apex.
This is classic energy compression, not breakdown.
Momentum confirms it. On the 3M:
MACD is flat to slightly negative; not impulsive, but no longer collapsing.
RSI is hovering in the mid-40s to low-50s range, consistent with a base-building process rather than a volatility downtrend.
This is not a signal that markets are about to crash. But it is a signal that the era of effortless, volatility-free upside is behind us.
Importantly, volatility no longer needs a crisis to stay bid. It’s being supported structurally; even while equity indices remain near highs. That divergence is subtle, but it’s exactly what you expect late in a cycle when risk is repriced through time, not price.
From a macro perspective, this aligns cleanly with what we’re seeing elsewhere:
• Silver pressing a generational ceiling.
• The S&P grinding higher but deep into its upper channel.
• The dollar losing structural support and beginning to roll over on higher timeframes.
The VIX is not screaming. But it is whispering. And what it’s whispering is this: volatility is no longer fully suppressed; it’s being stored.
As long as the VIX remains above its rising base and continues to form higher lows, markets should be approached with discipline rather than complacency. This is a regime where hedges start to make sense again; not because disaster is imminent, but because asymmetry has quietly shifted.
In short: No panic. No fear. But the days of free convexity are over.
U.S. Dollar Index | Secular Pressure Reasserting Itself
On the 6-monthly chart, the dollar is finally doing what a lot of people have been calling far too early for years but this time the structure actually supports it. This is not just noise on a weekly or monthly timeframe. This is a real breakdown attempt on a macro lens that matters.
Price has slipped out of the broader long-term containment zone, and more importantly, momentum has rolled. The 6M MACD is no longer merely flattening; it is turning down decisively after failing to reclaim prior highs. That combination - loss of structure and rolling momentum - is what separates a corrective pullback from a regime shift attempt.
Context matters here. The dollar’s multi-decade strength phase peaked structurally in the early 2000s, followed by a long, volatile distribution. The post-2011 uptrend that many still anchor to has been steadily losing slope, and what we’re seeing now looks less like a healthy consolidation and more like erosion from underneath.
RSI confirms the message. On this timeframe, it is rolling over from neutral rather than rebounding from oversold; a subtle but important distinction. This isn’t panic selling; it’s persistent weakness. The kind that grinds rather than collapses.
That said, this is not a one-way call. From a pure structure perspective, the dollar is entering a decision zone, not freefall. Failed breakdowns are common at this scale, and any sharp counter-trend rally back into the prior channel would immediately neutralise the bearish case. But as it stands right now, the burden of proof has shifted back to the bulls.
Macro-wise, this lines up cleanly with the rest of the landscape:
Commodities have already broken or are pressing secular resistance.
Copper - for instance - is leading rather than lagging.
Volatility is no longer suppressed.
Equities are strong, but late in their channel.
A weakening dollar is the fuel, not the headline, and on this timeframe, the fuel line is finally leaking.
Bottom line: This is the first time in years where the dollar looks genuinely vulnerable on a multi-month horizon. Not collapsed. Not panicking. But structurally rolling over. If this 6M weakness persists, it supports the idea that the next macro leg - whatever form it takes - is likely to be driven by real assets outperforming paper ones, not the other way around.